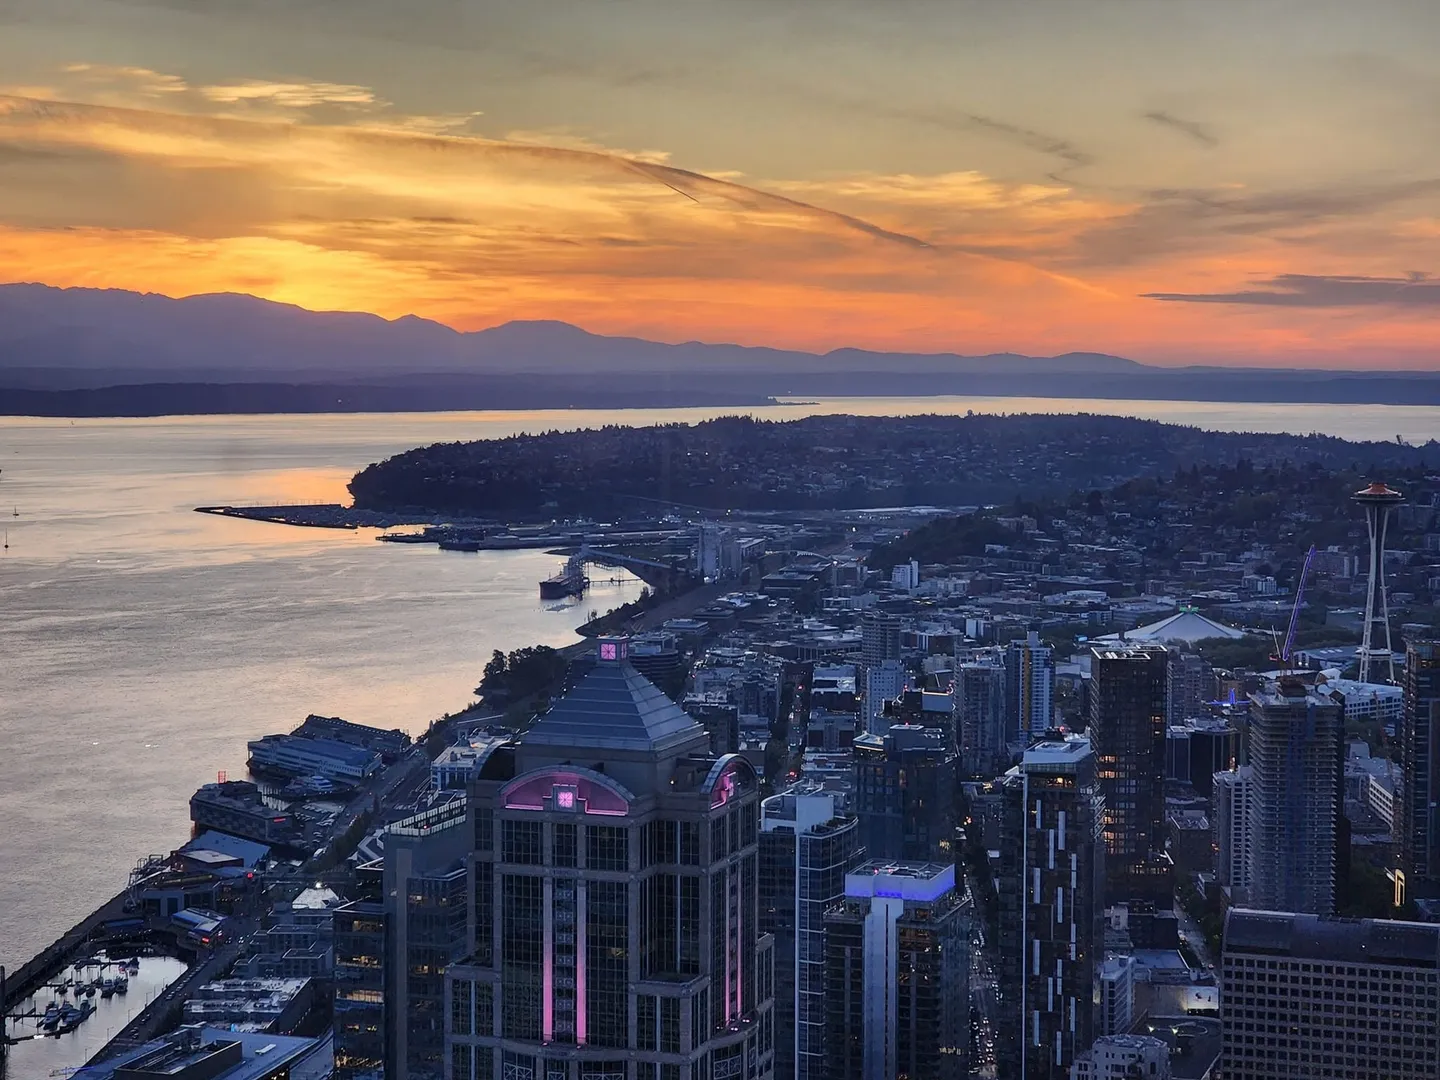
Seattle has the best summers in the world.1 And lately it’s felt like we’re getting more of them: summer showing up in May instead of July, more clear sunny days, and the rain switching from our infamous drizzle to actual storms. But “it feels like” makes me wonder… Is it true?
So, lazy person that I am, I asked Claude to check.
The prompt
Anecdotally, it feels like climate change is making for longer summers in Seattle with sunnier days in the last 20 years. Seattle has been known for being rainy and drizzly, but the storms seem more intense instead of drizzly, and summers seem to start in May instead of July. Can you research public data and show if or how the weather patterns have changed in the last 20 years? Put together a visually impressive HTML website to summarize and highllight the data.2
What came back used NOAA’s daily records from Sea-Tac Airport, every day since 1948,3 and compared the last twenty years (2006–2025) with the twenty before them (1986–2005). Each of my hunches got a verdict, and I didn’t love all of them.
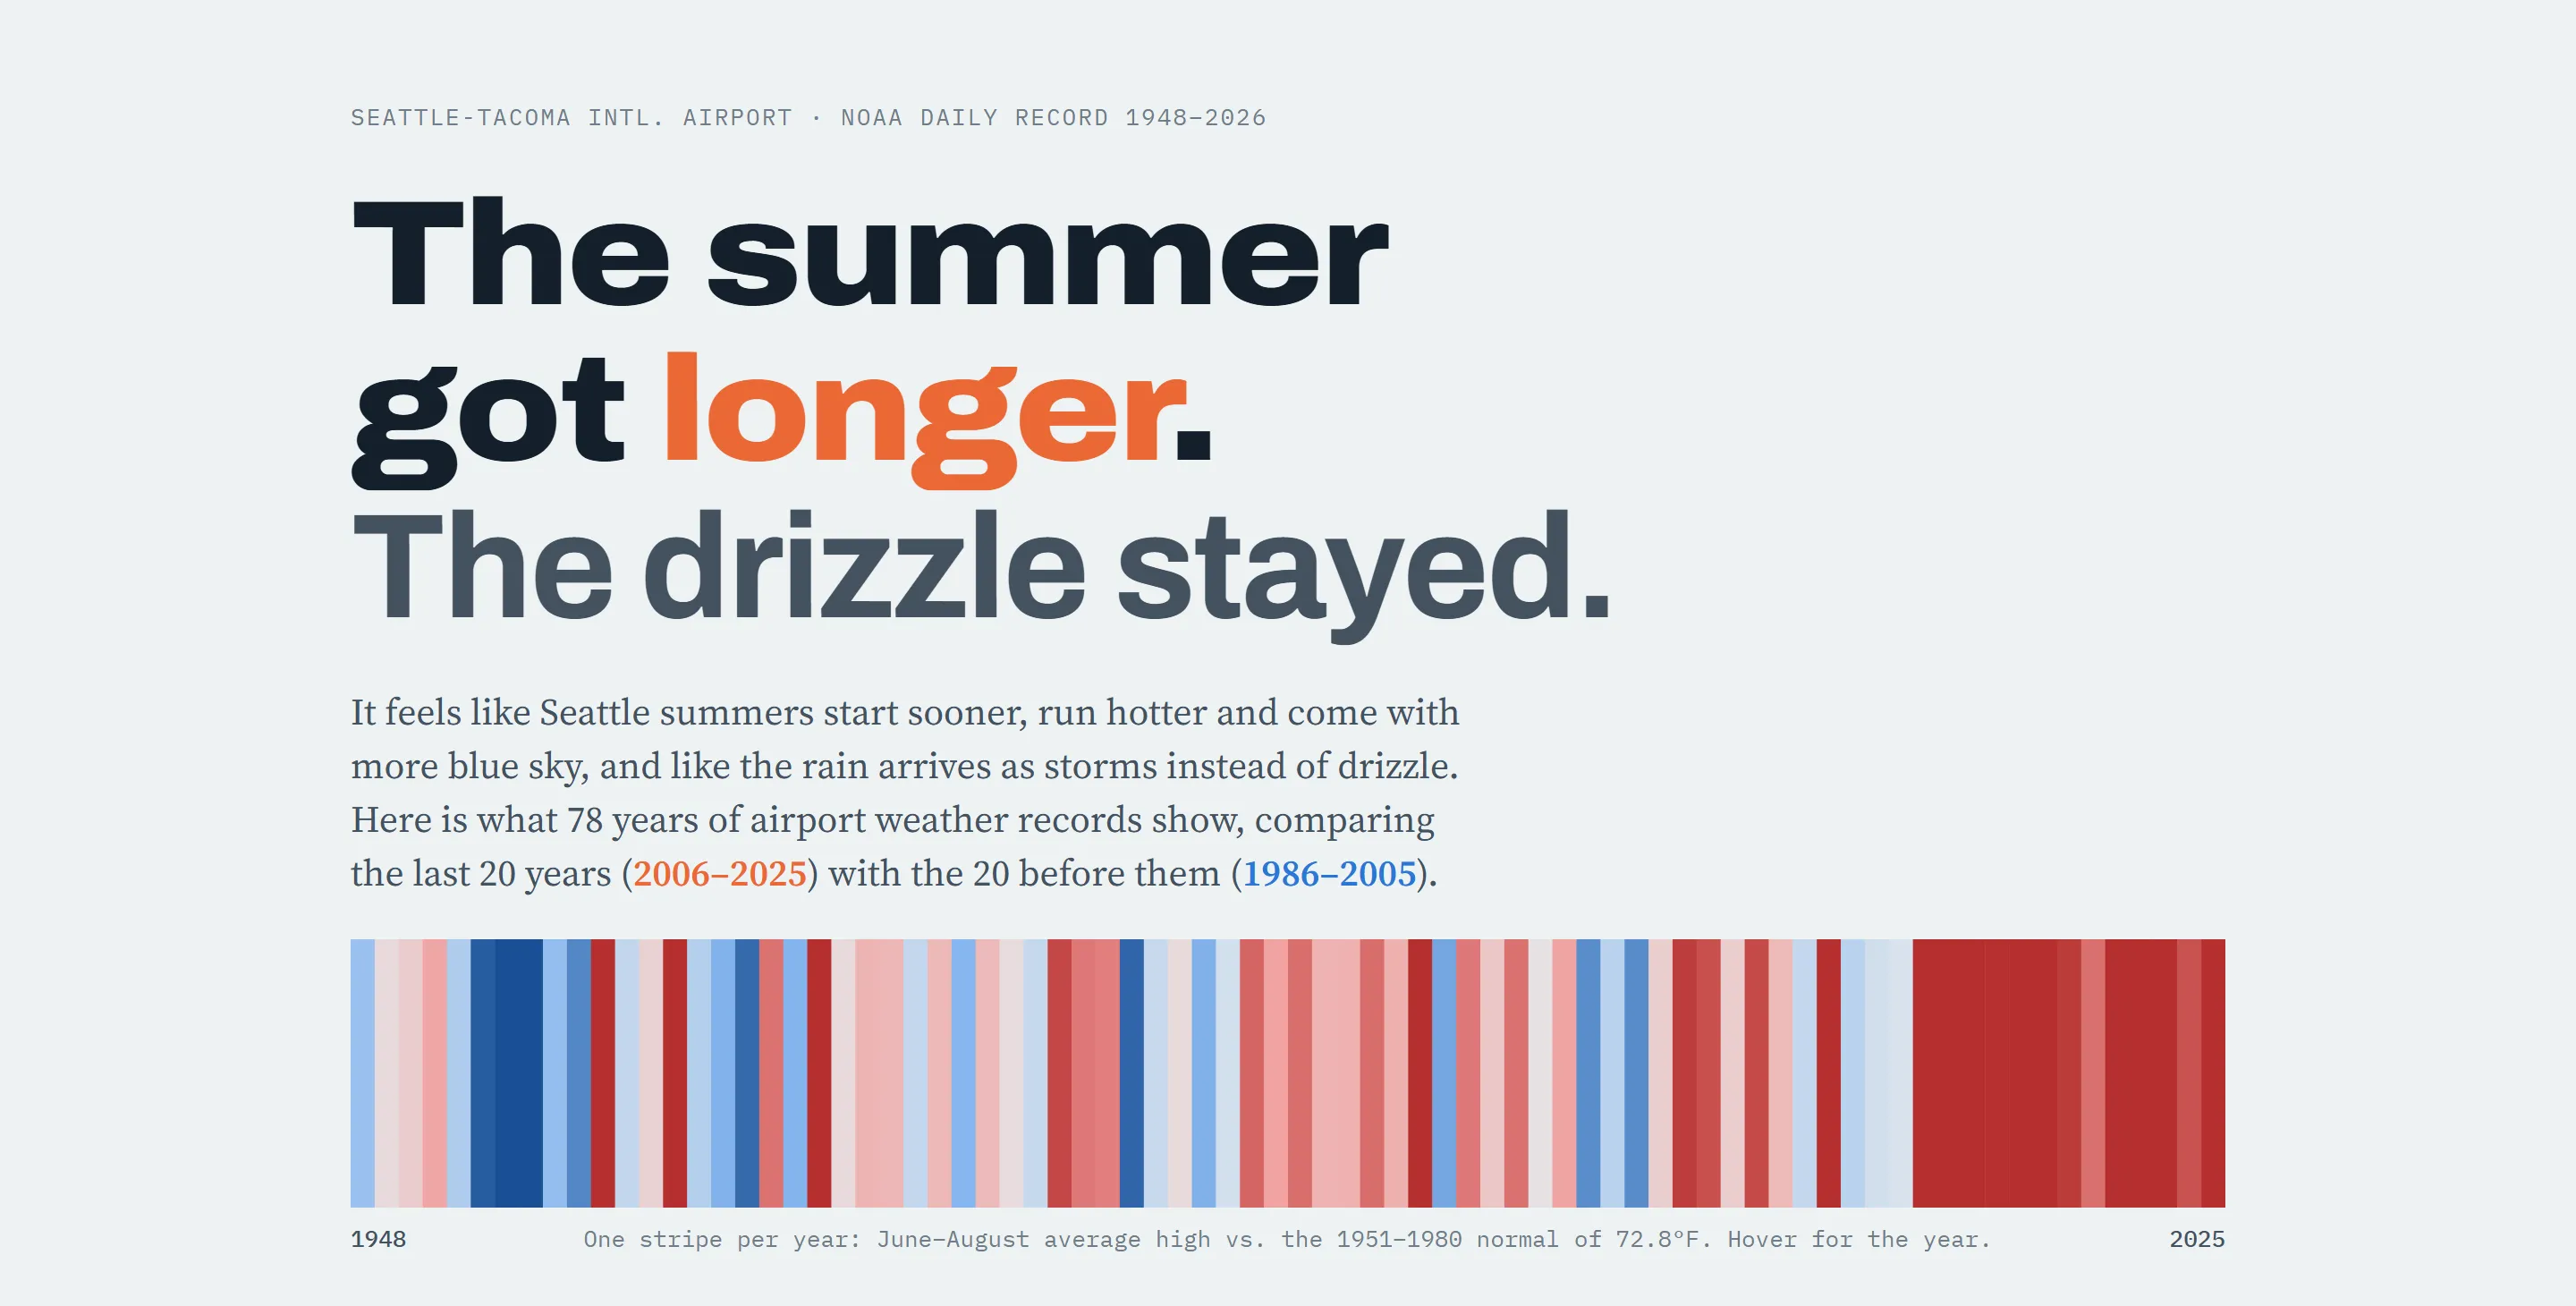
One stripe per summer. You can probably guess which end is now.
The vibes, checked
- Longer, hotter summers: YES. The stretch of the year when a normal day tops 75°F grew from 42 days to 64. That’s about three extra weeks of summer. Days over 80°F went from 27.5 a year to 36.3, and days over 90°F doubled, from 2.3 to 4.7. Climate change like this is on my Doom Board, but I will guiltily admit I love this sunshine.
- Summer starts in May: PARTLY. Summer did move earlier, but by about a week, not two months. The normal high now hits 70°F on June 11 instead of June 18, and 65°F on May 12 instead of May 19. May itself is 1.7°F warmer (Wow…). So where did my May starts in summer vibes come from? This year. 2026’s first warm week started on May 1, and only six years since 1948 have started earlier (1976, 1977, 1998, 2004, 2016 and 2021). I’d taken one great May and wished it into a trend.
- More sunny days: ONLY IN JULY. July lost two rainy days, from 5.3 to 3.3. But February, March, September and November all got dimmer (NOOO…), and over the whole year it’s flat to slightly down. Sigh.
- Storms instead of drizzle: WELL…. Downpour days (an inch of rain or more) went from 4.5 a year to 5.9, up 31% (YIKES!). But the drizzle days didn’t go anywhere (YIKES!). They went up, from 64 to 67. If anything, Seattle has added storms on top of the drizzle. Bring a jacket but not an umbrella, you tourist!4
The fine print
This is the part I appreciated most, because it’s the part I wouldn’t have thought to ask for (though sometimes I do ask Claude for the offbeat):
- Sea-Tac probably runs warm. It’s an airport, which means a lot of pavement, and it got a third runway in 2008. Olympia’s airport shows summers warming by 1.2°F against Sea-Tac’s 2.0°F, so the warming is real and regional, just maybe and hopefully a bit exaggerated here.
- 1986–2005 was a dry stretch. Compared with the full record back to 1948, the long-term rain trend is flat. Picking your comparison years matters, though of course within the last decade everything goes off the rails.
- Sunshine is the hardest to measure. (According to Claude) It came from two other datasets, not the airport’s own record (ERA5 and NASA POWER).5 They only agree on July getting sunnier and those four months getting dimmer. Good to get that info.
It’s so easy to get AI to agree with you. Asking it to check a hunch against public data, and getting back an answer with caveats was far more useful than another chatbot cheerfully confirming what I already believed.6
Then, for fun: six ways to see one dataset
Once the data was solid, the presentation became the cheap part, just like with my job board themes. So I asked for more:
Let’s create 5 other pages/templates to view this data. I’m thinking that each one should approach this from a different angle. One of them has to be apocalyptic (for fun :) ). One should have some Korean anime style characters providing exclamations in Korean. One should be very humorous, Douglas Adams Hitchhiker’s Guide style. All should be true to the data, but slice it and dice it however you see fit!
“True to the data” was the important part. Don’t lie to me, Claude! Everyone knows that’s the secret prompt for success. Anyway, every one of these uses the same numbers as the main report:
- The Long Summer: an apocalyptic emergency bulletin, with a sober-mode switch for when you want the facts without the sirens.
- Haru and Bi: two original cartoon spirits arguing in Korean about whose city Seattle is. Haru (하루, “day”) is a sun spirit, Bi (비, “rain”) is a grumpy rain cloud, and every speech bubble has the Korean, a romanization and a translation. So it’s secretly a Korean lesson.7
- The Damp Traveller’s Guide: a deadpan guidebook entry in the Douglas Adams style. “Seattle: a city that is slightly less damp than advertised.”
- Seattle Date Odds: pick a date and get the historical odds for that day, then and now. Planning a barbecue? This one’s for you.
- Seventy-Nine Summers: every day since 1948 as a sliver in a ring, one ring per year, so all the summers line up at the bottom.
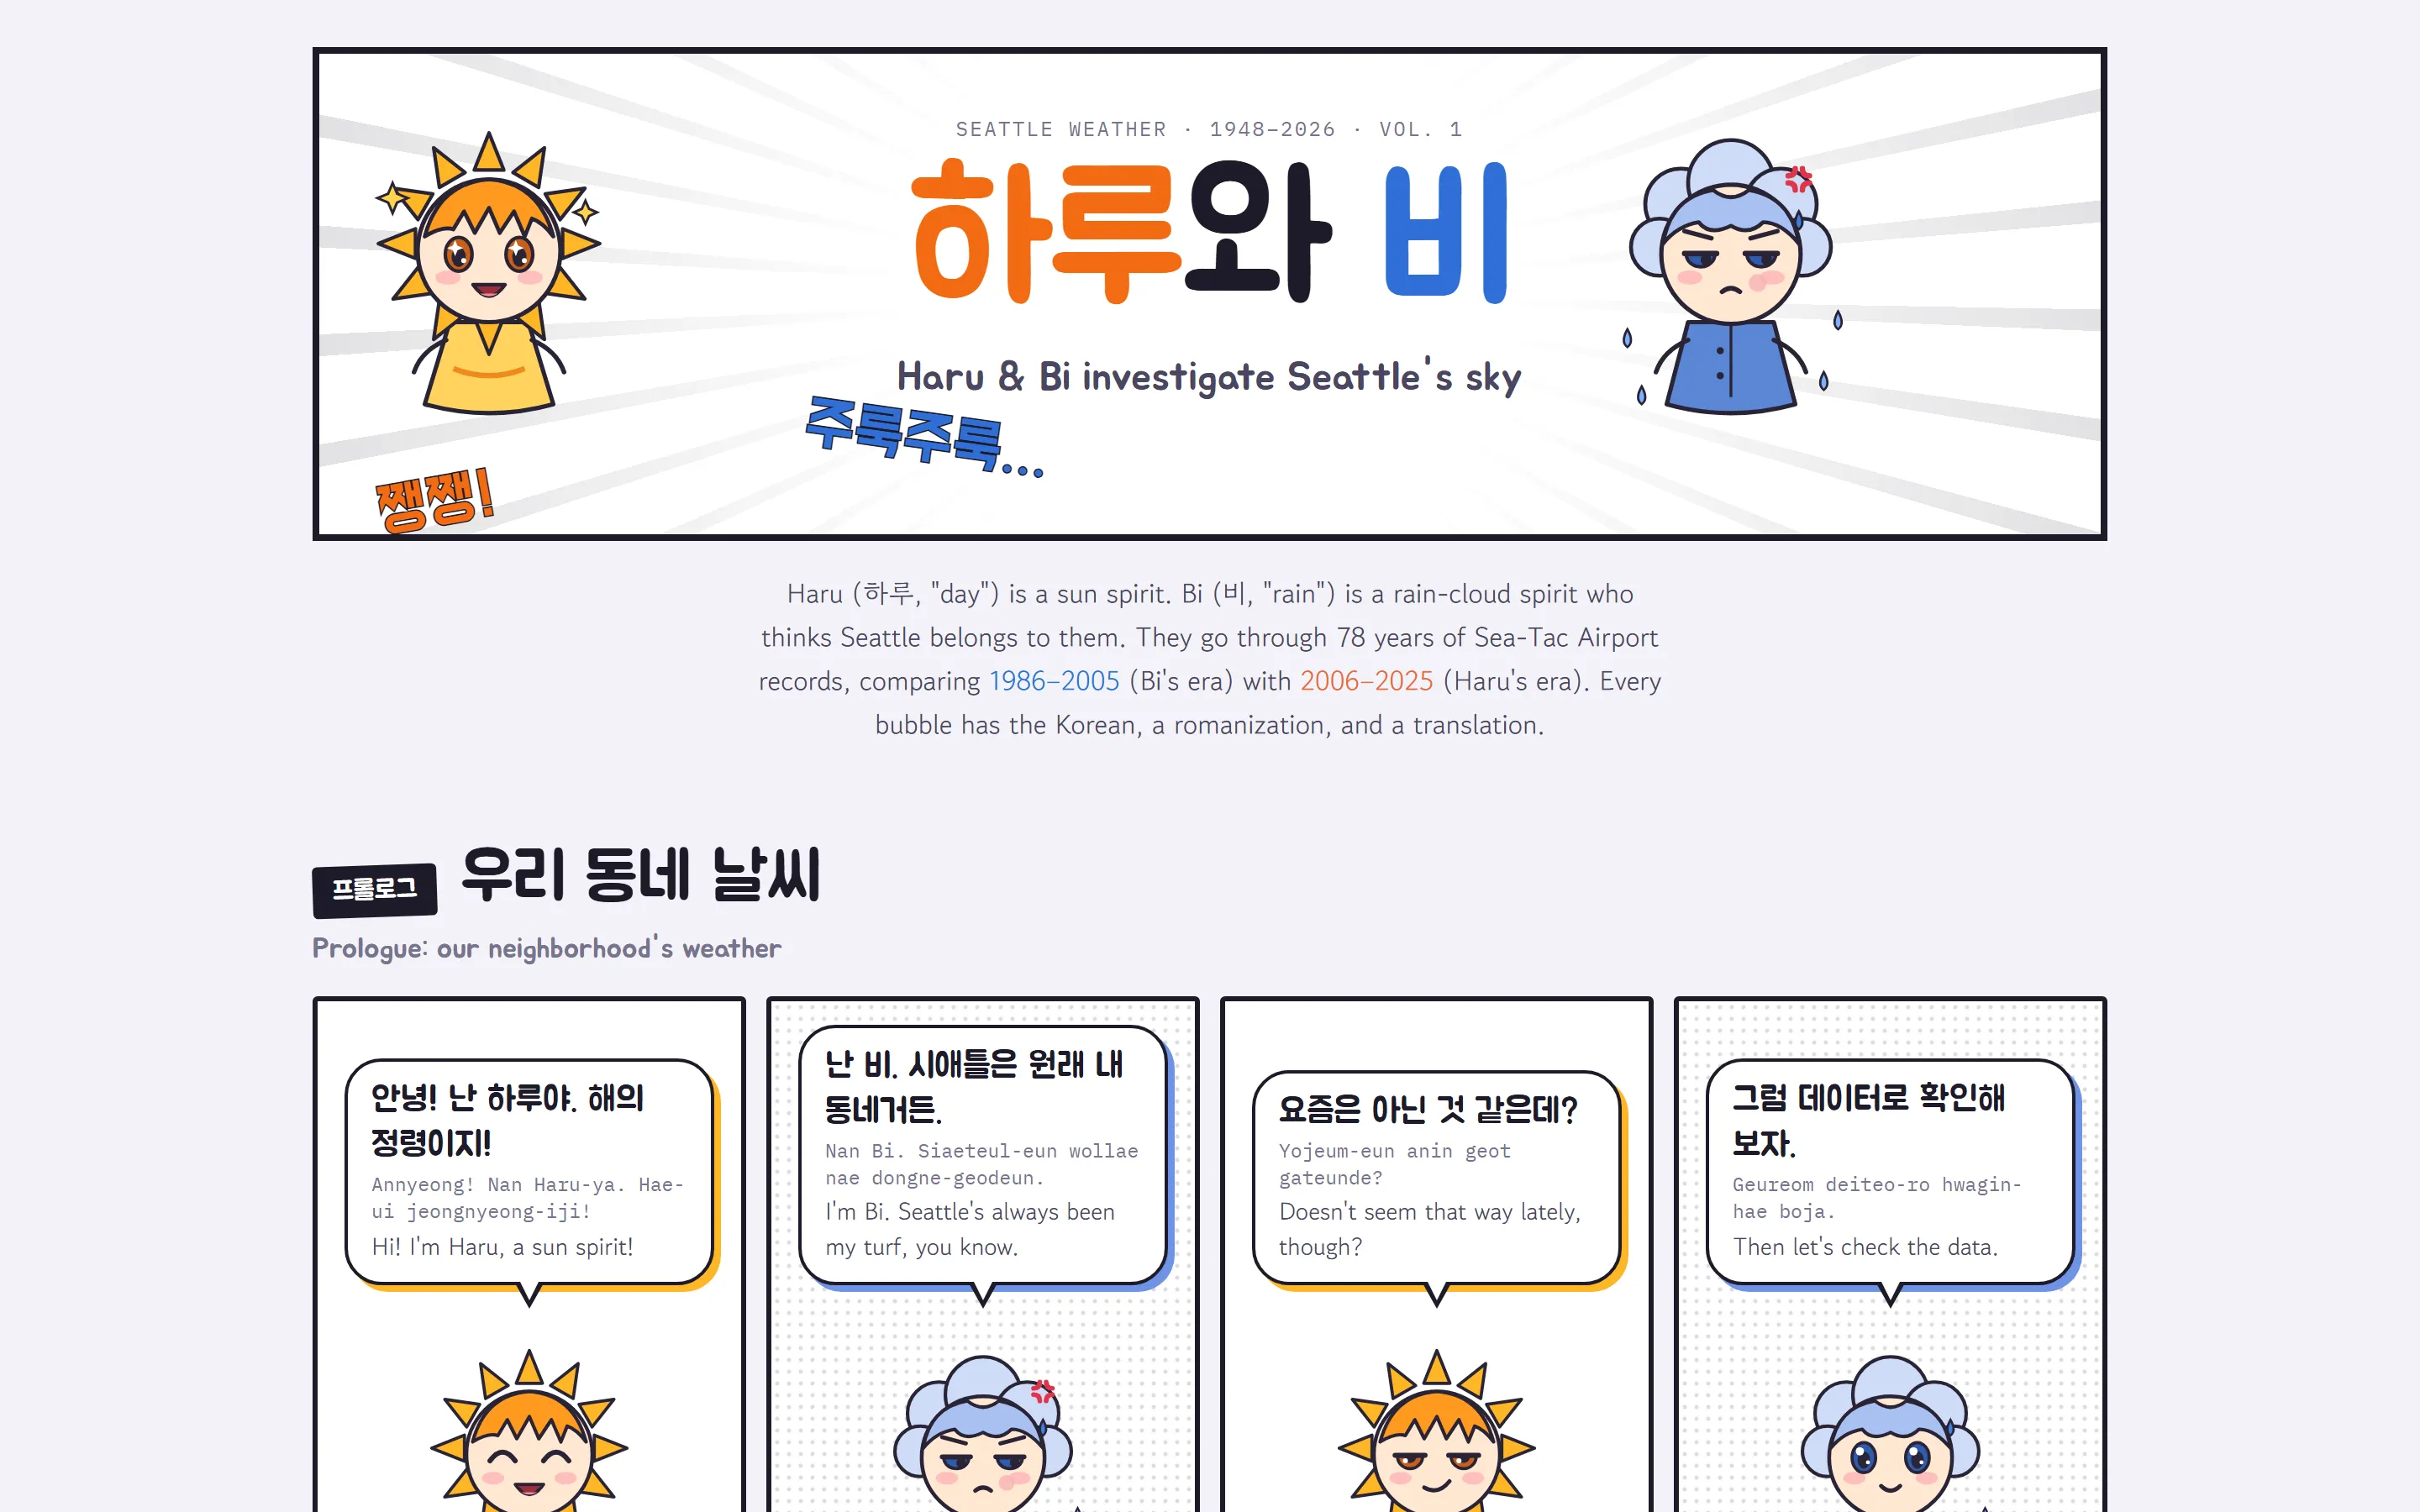
Haru and Bi, both convinced it’s their city. Bi is not having a good decade.
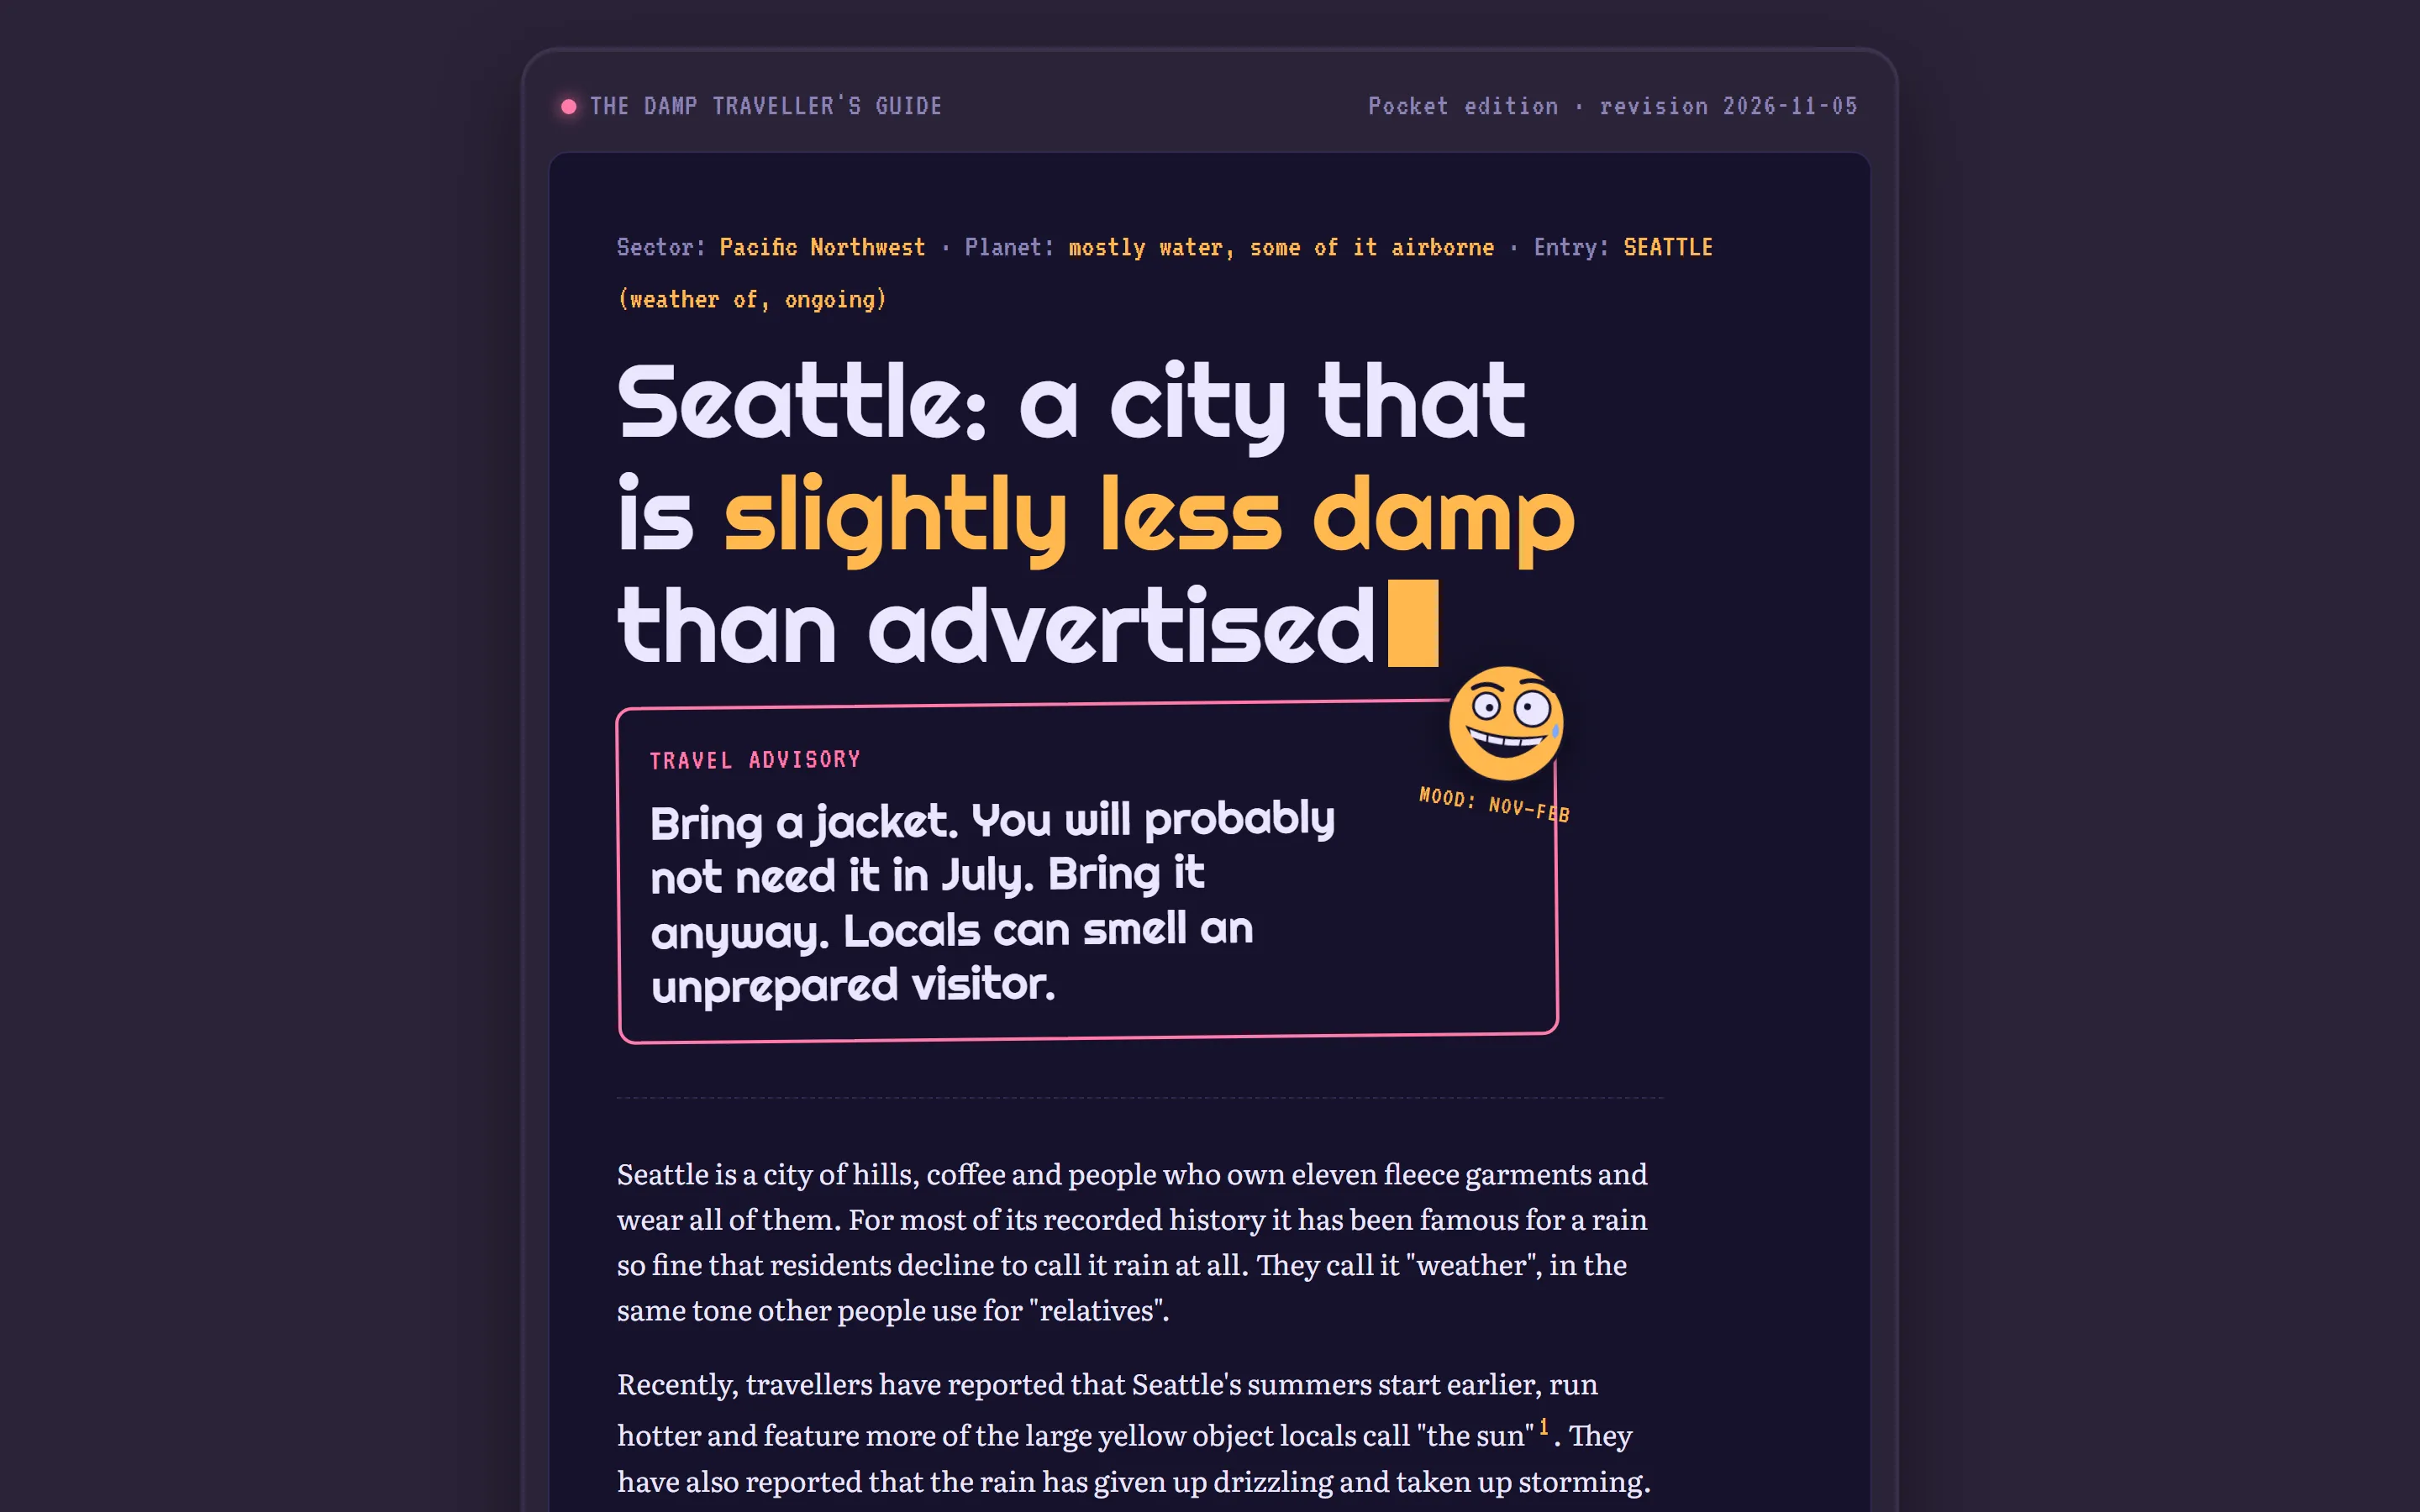
I asked for a slightly manic smiley face somewhere on this one. Slightly manic is Seattle in November through February, am I right?
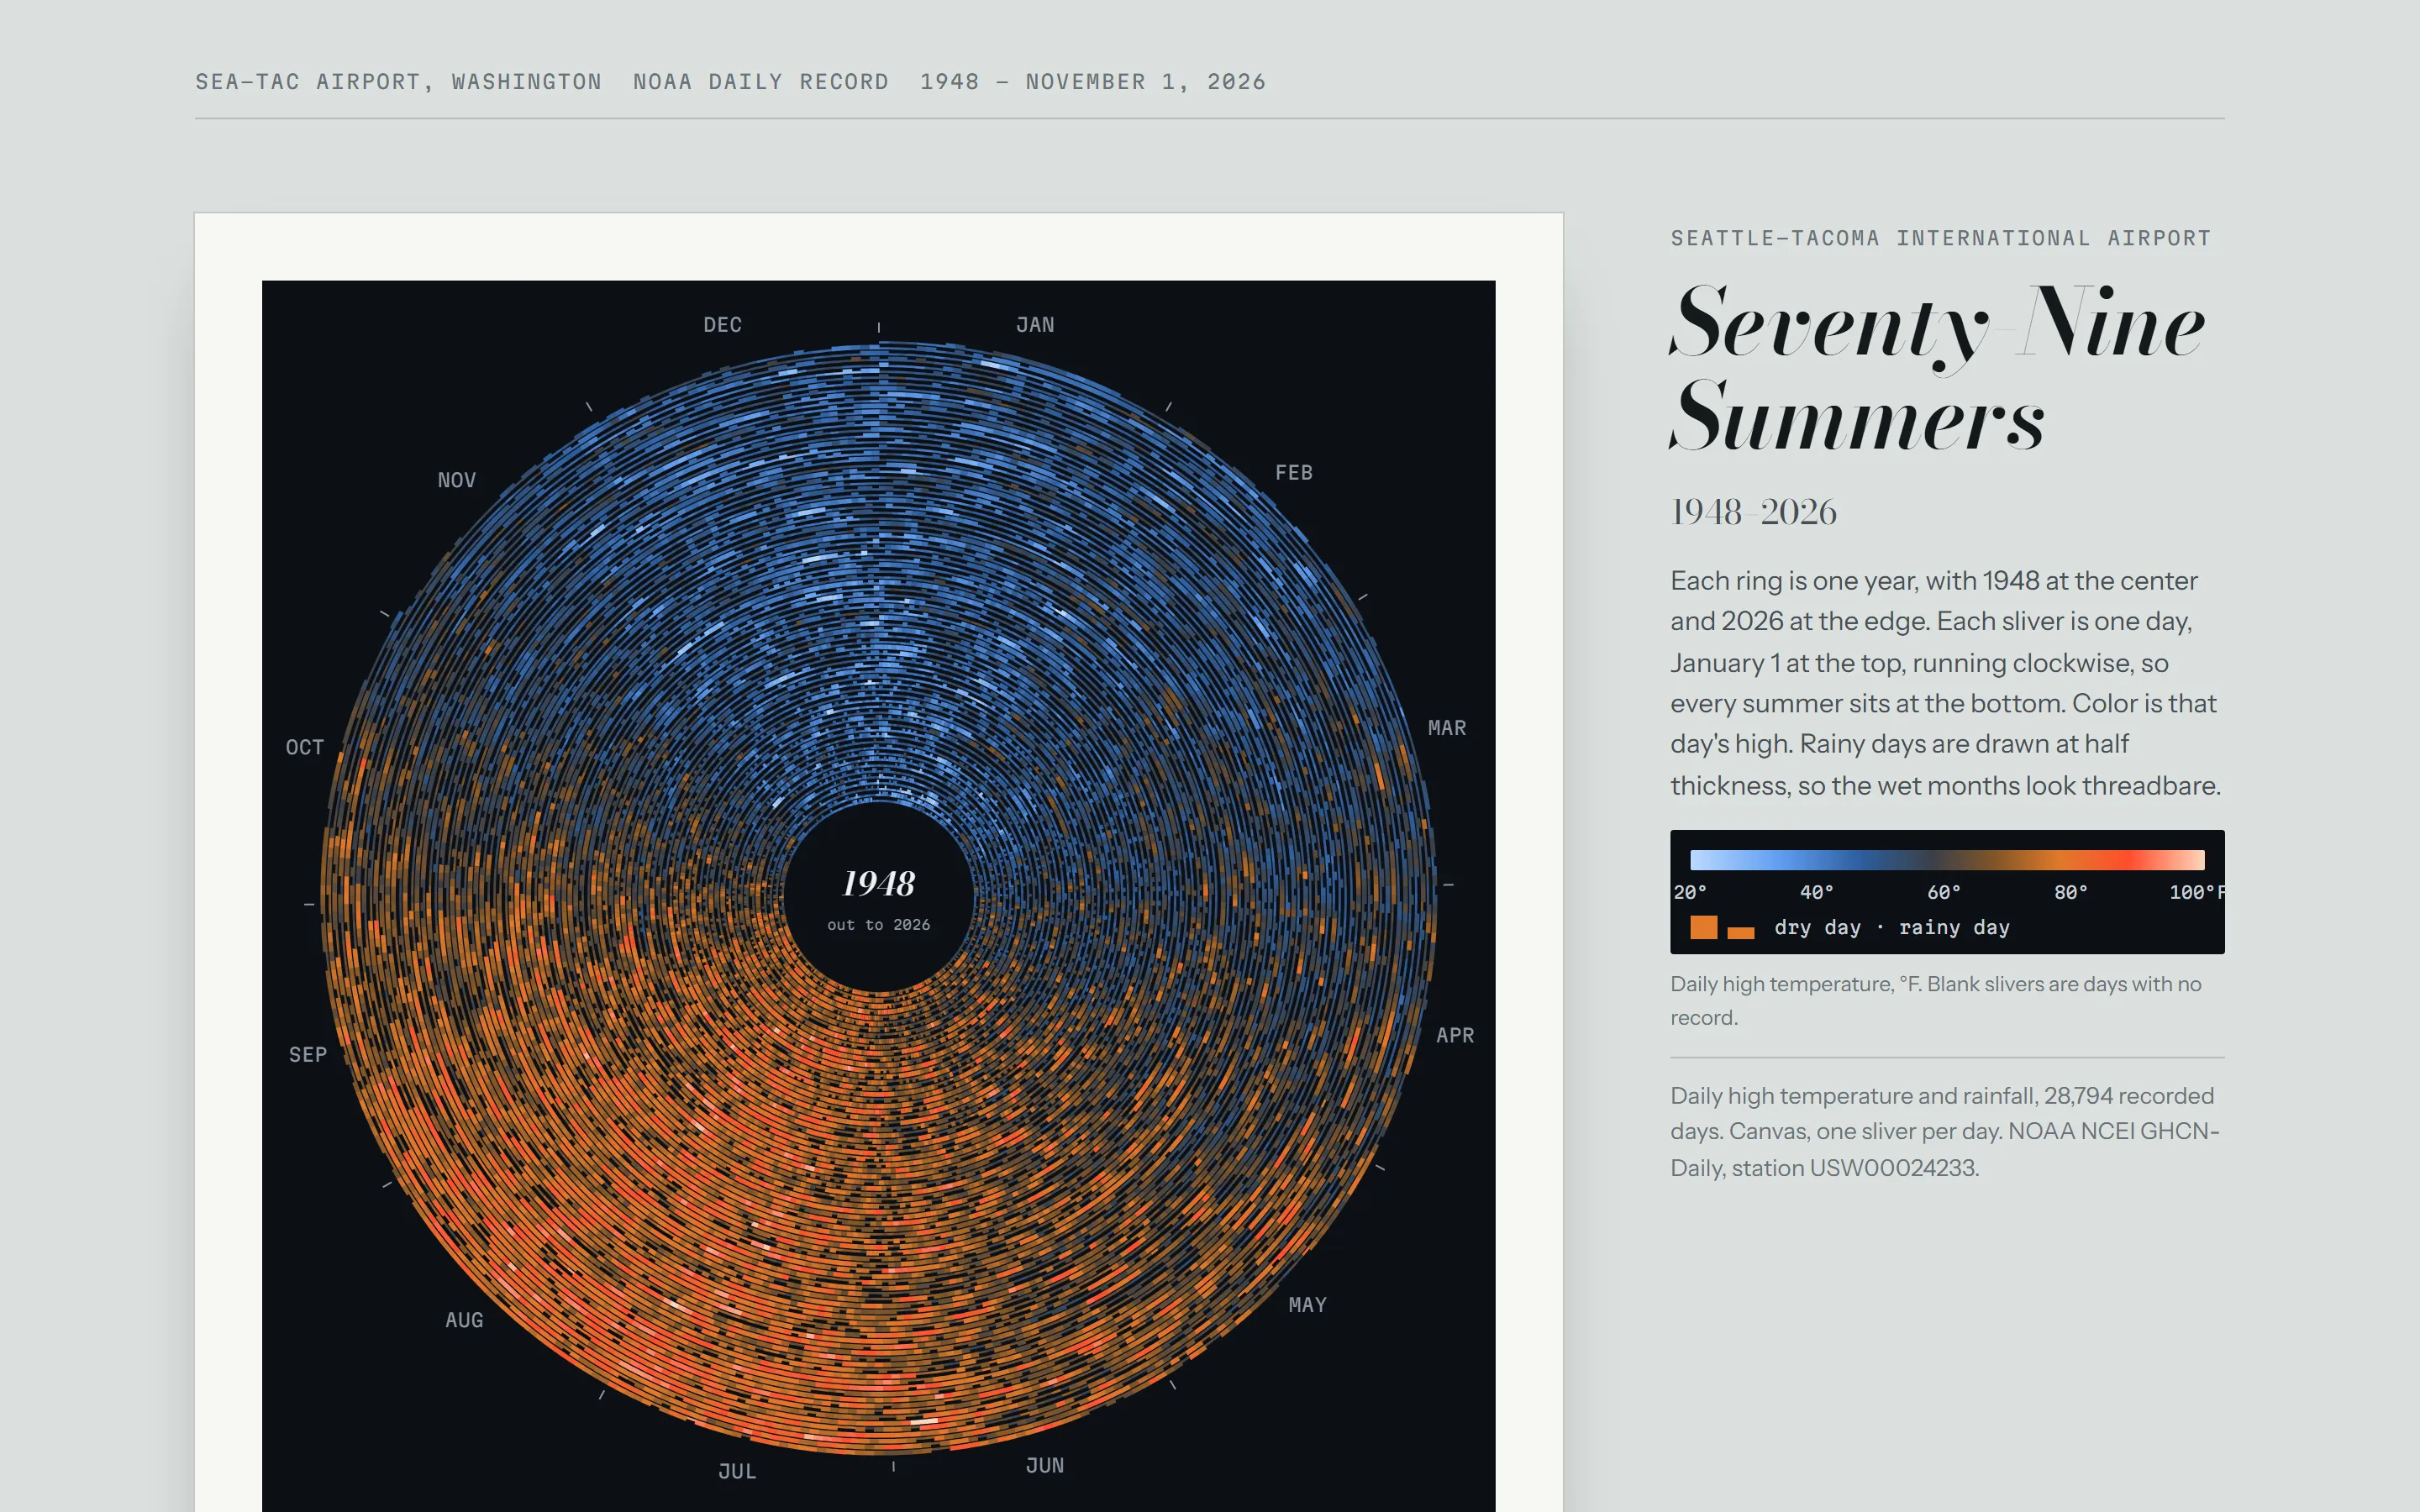
28,794 days in one picture. The summers are at the bottom, and they’re getting redder as you go out.
Then one last ask, because I like having my silly explorations on my own machine:
I want to be able to run all locally on my computer too, with a selector so that I can flip through them.
So now there’s a little viewer on my laptop where I can flip through all six with the arrow keys, and one command downloads fresh data from NOAA and rebuilds the lot.
What I learned
The data work was the real project – at least according to Claude. Fetching 78 years of daily records, deciding what counts as a “downpour,” choosing fair comparison years and checking against a second airport: that’s where the value is. Once it was done, each new view took minutes, and they’re templates now, so I can point them at any dataset I like. My limited human brain at least thought ahead far enough to create something I can re-use.8
And my favorite part was being told I was wrong about May. Sorry, Keith, I should tell you that too. Of course it’s late fall spreading into rainy stormy winter here, so time for another analysis!
Footnotes
-
If it were not true, all of us would have left by now. Except for those who love the gloom and complain when it doesn’t rain every week. ↩
-
Typos preserved, as usual. Apparently I really wanted that data highlighted. And I want a visually impressive HTML website, whatever that means! ↩
-
NOAA’s GHCN-Daily, Sea-Tac station USW00024233, through November 1, 2026. It’s all free and public. Check it out! You gotta love free data and AI making a fun little hobby something you can learn from. ↩
-
For my fellow non-statisticians (I am more of a vibes guy): the downpour increase has a p-value of 0.13, which means it could still be chance. More storms looks likely, but it isn’t proven yet. ↩
-
ERA5 is a European reconstruction of past weather from every observation they can get their hands on. NASA POWER does something similar, apparently. Maybe staring at the sky should be my next job. ↩
-
Can we trust the analysis? This is just for fun, but for real data analysis I would spend an exhausting amount of time confirming. However, compared to 6 months ago or a year ago, the hallucinations are much, much better. And having different AI companies and models verify the results helps too. ↩
-
As an intermediate Korean learner, I like to work in experiments like this to practice, as well as for my language learning app that I’m working on. 비 is also just the word for rain, so Bi is literally named Rain, which feels right for a Seattle cloud. (Also apparently the stage name of a K-pop star. I’m more of a Kpop first gen guy.) ↩
-
I’ve already pointed them at my water bills, which also have some fun data about my usage. The Dampness Guide version tried its best. ↩